Skip Navigation
Skip to contents

CPP : Cardiovascular Prevention and Pharmacotherapy

Sumissioin : submit your manuscript
SEARCH
Search

Articles

Page Path
HOME > Cardiovasc Prev Pharmacother > Volume 3(4); 2021 > Article
Original Article
Modeling of Changes in Creatine Kinase after HMG-CoA Reductase Inhibitor Prescription
Hun-Sung Kim, MD, PhD1,2orcid, Jiyoung Min, MS1orcid, Jiwon Shinn, BA1orcid, Oak-Kee Hong, PhD3orcid, Jang-Won Son, MD, PhD4orcid, Seong-Su Lee, MD, PhD4orcid, Sung-Rae Kim, MD, PhD4orcid, Soon Jib Yoo, MD, PhD4orcid
Cardiovascular Prevention and Pharmacotherapy 2021;3(4):115-123.
DOI: https://doi.org/10.36011/cpp.2021.3.e15
Published online: October 31, 2021

1Department of Medical Informatics, College of Medicine, The Catholic University of Korea, Seoul, Korea

2Division of Endocrinology and Metabolism, Department of Internal Medicine, Seoul St. Mary's Hospital, College of Medicine, The Catholic University of Korea, Seoul, Korea

3Department of Internal Medicine, College of Medicine, The Catholic University of Korea, Seoul, Korea

4Division of Endocrinology and Metabolism, Department of Internal Medicine, Bucheon St. Mary's Hospital, College of Medicine, The Catholic University of Korea, Bucheon, Korea

Correspondence to Soon Jib Yoo, MD, PhD Division of Endocrinology and Metabolism, Department of Internal Medicine, Bucheon St. Mary's Hospital, College of Medicine, The Catholic University of Korea, 327 Sosa-ro, Bucheon 14647, Korea. E-mail: sjyoomt@gmail.com
• Received: October 21, 2021   • Accepted: October 31, 2021

Copyright © 2021. Korean Society of Cardiovascular Disease Prevention; Korean Society of Cardiovascular Pharmacotherapy.

This is an open-access article distributed under the terms of the Creative Commons Attribution Non-Commercial License (http://creativecommons.org/licenses/by-nc/4.0/) which permits unrestricted non-commercial use, distribution, and reproduction in any medium, provided the original work is properly cited.

  • Background
    Statin-associated muscle symptoms are one of the side effects that physicians should consider when prescribing statins. In this study, creatine kinase (CK) levels were measured following statin prescription, and various factors affecting the CK levels were determined using machine learning.
  • Methods
    Changes in the CK were observed every 3 months for a 12-month period in patients who received statins for the first time at Seoul St. Mary's Hospital. For each visit, we developed four basic models based on changes in the CK levels. Extreme gradient boosting, a scalable end-to-end tree boosting algorithm, which employs a decision-tree-based ensemble machine learning algorithm, was used for the prediction of changes in the CK.
  • Results
    A total of 23,860 patients were included. Among them, 19 patients (0.08%) had increased CK levels of 2,000 IU−1 or more 3 months after statin prescription, and 65 patients (0.27%) exhibited CK levels of over 2,000 IU·L−1 at least once during the 12-month study period. The area under the receiver operator characteristic of each model for each visit was 0.709–0.769, and the accuracy was 0.700–0.803. In each of the models, the variables that had the strongest influence on changes in the CK were sex and previous CK value.
  • Conclusions
    Through machine learning, factors influencing changes in the CK were identified. These results will provide the basis for future research, through which the optimal parameters of the CK prediction model can be found and the model can be used in clinical applications.
Statins, also known as 3-hydroxy-3-methylglutaryl coenzyme A reductase inhibitors, or HMG-CoA reductase inhibitors, are frequently prescribed drugs for the prevention of cardiocerebrovascular disease.1)2) Although statins have various advantages, they also exert side effects such as hepatotoxicity and diabetes mellitus. Among them, statin-associated muscle symptoms (SAMS) are the most difficult to objectively assess and diagnose.3)4)
In the Korean Adverse Event Reporting System (KAERS) database, myalgia accounts for the highest frequency (approximately 12.2%) among all side effects of statins.5) However, the causes of myopathy are diverse, and even if myopathy develops after statin prescription, it is not certain whether the muscle symptoms are actually caused by statins.6) As such, myalgia is a subjective symptom, and it is, therefore difficult to obtain a clear approach to managing such side effects. However, the levels creatine kinase (CK), also known as creatine phosphokinase (CPK), can be considered objective indicators.7)8)
SAMS is known to occur most frequently approximately 6 months after statins are first prescribed.9) Therefore, in this study, patients were followed up for 12 months after being given their first statin prescription, and the changes in their CK values over time were modeled through machine learning. In addition, we investigated various factors affecting their SAMS.
From 2009 to 2018, patients over 18 years of age who were first prescribed statins at Seoul St. Mary’s Hospital were included in the study. The types of statins included atorvastatin, pitavastatin, pravastatin, rosuvastatin, simvastatin, and a statin/ezetimibe combination. The index date (baseline, visit 0) was set as the first day of statin prescription. A visit 2–4 months after the index date was defined as “visit 1 (average of 3 months later),” a visit 5–7 months after the index date was defined as “visit 2 (average of 6 months later),” a visit 8–10 months after the index date was defined as “visit 3 (average of 9 months later),” and a visit 11–13 months after the index date was defined as “visit 4 (average of 12 months later).” Baseline characteristics, such as age, sex, body mass index (BMI), and blood pressure were recorded on the index date. Blood urea nitrogen (BUN), creatinine, estimated glomerular filtration rate (eGFR), total cholesterol, triglyceride, high-density lipoprotein cholesterol (HDL-C), low-density lipoprotein cholesterol (LDL-C), aspartate aminotransferase (AST), alanine aminotransferase (ALT), and CK levels were also documented on the index date. Patients with baseline CK values of less than 200 IU·L−1 were included in this study. CK and eGFR were also measured at each visit. Patients whose CK levels were not measured during the four follow-up periods were excluded from this study.
Patients were checked for their history of hypertension, diabetes mellitus, hypothyroidism, or cancer. Current medications, such as fenofibrate, gemfibrozil, propranolol, thyroxine, and warfarin, were also documented. Statins were divided into four groups according to the LDL-C lowering effect: pravastatin (10 mg, 20 mg) as the low-intensity group; atorvastatin (10 mg), pitavastatin (2 mg), pravastatin (40 mg), rosuvastatin (5 mg), and simvastatin (20 mg) as the low-moderate intensity group; atorvastatin (20 mg), pitavastatin (4 mg), rosuvastatin (10 mg), and simvastatin (40 mg) as the moderate-high intensity group; and atorvastatin (40 mg, 80 mg) and rosuvastatin (20 mg) as the high-intensity group. In the case of the statin/ezetimibe combination, the groups were classified according to their statin dose.
Modeling according to changes in CK
The CK values were classified as follows: ≤200 IU·L−1, normal; 201–2,000 IU·L−1, borderline; and ≥2,000 IU·L−1, abnormal. We aimed to develop four basic CK prediction models. First, the CK values at visit 1 were predicted using the baseline characteristics (prediction model V1). Second, the CK values at visit 2 were predicted using the baseline characteristics and eGFR/CK values at visit 1 (prediction model V2). Third, the CK values at visit 3 were predicted using the baseline characteristics and eGFR/CK values at visits 1 and 2 (prediction model V3). Fourth, the CK values at visit 4 were predicted using the baseline characteristics and eGFR/ CK values at visits 1, 2, and 3 (prediction model V4).
Privacy protection
This was a retrospective cohort study. There were no physical risks to the patients, given that we used data from past electronic medical records (EMRs). The data extracted in the study are stored as an encrypted file in an anonymized format on an encrypted computer of one of the researchers. No other researchers have access to this information. The need for informed consent was not required because of the nature of the EMR-based retrospective cohort study. This study was approved by the Institutional Review Board of the Catholic University of Korea (IRB No. KC21RISI0655).
Statistical analysis
XGBoost (eXtreme Gradient Boosting),10) a scalable end-to-end tree boosting algorithm, is a widely used decision-tree-based ensemble machine learning algorithm based on the gradient boosting decision tree (GBDT)11) technique, which generates a prediction model in the form of an ensemble of weak prediction models of decision trees. GBDT-based approaches, particularly XGBoost, show a promising performance on many tabular-dataset learning tasks, as confirmed through various Kaggle or KDD Cup competitions, where XGBoost has been the winning approach and has outperformed other machine learning methods.12-14)
A total of 23,860 patients were included in this study, and data from 2009 to 2018 were used. The mean age of the patients was 58.2±13.2 years, and 48.6% (11,593/23,860) were male (Table 1). The mean BMI was 24.3±3.6 kg·m−2, and the mean eGFR was 79.9±28.1 mL·min−1·1.73 m−2. The mean CK level was 82±41 IU·L−1.
After dividing the baseline and each visit into normal (CK≤200 IU·L−1), borderline (200 IU·L−1< CK≤2,000 IU·L−1), or abnormal (CK>2,000 IU·L−1), the change in CK was checked for 12 months. After 3 months in the baseline group, 64.2% (15,309/23,860) of the patients remained in the normal group, 3.1% (741/23,860) were in the borderline group, and 0.08% (19/23,860) showed a marked increase in their CK values and were classified into the abnormal group. There were a total of 0.27% (65/23,860) patients for whom the CK values increased to over 2,000 IU·L−1 at least once during the visit period (19, 14, 16, and 16 patients at visits 1, 2, 3, and 4, respectively).
At a threshold of 0.5, the area under the receiver operating characteristic (AUROC) of Models 1, 2, 3, and 4 were 0.709, 0.736, 0.766, and 0.769, respectively (Figure 1 and Table 2). The accuracy of the model was the highest at 0.803 for Model 3, 0.777 for Model 4, 0.701 for Model 2, and 0.700 for Model 1 (Table 2). The sensitivity, specificity, PPV, and NPV of Model 1 were 0.579, 0.710, 0.134, and 0.955, respectively. The sensitivity and NPV were highest in Model 2, and the specificity and PPV were the highest in Model 3.
When checking the change in the CK in each model, the most important variables (Figure 2A) and their influence (Figure 2B) were investigated. Based on the SHapley Additive exPlanations (SHAP) value, sex had the greatest influence on the change in the CK (SHAP value=0.3453). Moreover, when the previous CK value was ≥2,000 IU·L−1 (SHAP value=0.2458) and <200 IU·L−1 (SHAP value=0.1248), the change was also large. The BMI (SHAP value=0.0029), status of thyroxine intake (SHAP value=0.0022), statin potency (SHAP value=0.0010), and gemfibrozil intake (SHAP value=0.0000) did not show a significant influence on the change in the CK.
SAMS is the most common complication after statin prescription and shows varying symptoms; therefore, it is difficult to achieve a clear diagnosis. SAMS includes many subjective symptoms, and several studies have claimed that they are caused by the nocebo effect.6)15) In an analysis of 44 studies related to statins, SAMS occurred in an average of 1.9% of the patients taking atorvastatin.16) Based on an analysis of the atorvastatin dose, SAMS was highest in the 40-mg group; however, it occurred in less than 2.7% of the patients. By contrast, SAMS occurred in 1.3% of the patients in the 80-mg atorvastatin group, which was lower than that in the 40-mg group. In a study involving a placebo, the incidence of muscle symptoms after taking atorvastatin was not different from that after taking the placebo in a double-blind study.17) However, the results of open observational studies, in which patients were aware that they were taking a statin, were significantly higher than the placebo results. Thus, SAMS is a fairly subjective symptom, making it difficult to assess objectively. Therefore, to determine the actual prescription, a study of SAMS based on real-world evidence (EMR data) would be more advantageous than a double-blind study.18)19)
Because SAMS can appear with only an elevated CK and without muscle symptoms, a CK test is a parameter that can ensure objectivity.7)8) In this study, the number of cases without a baseline CK was also quite high at 36.7%. However, in this study, we utilized the current status survey rather than the change rate of the CK after a statin prescription to determine whether the CK was within the range of ≥200 IU·L−1 or ≥2,000 IU·L−1. Therefore, the absence of a baseline CK was not considered a factor for exclusion from this study. However, despite a baseline CK of ≥2,000 IU·L−1, the prescription of statins will likely require a more in-depth interpretation in the future.
Although predictive models for SAMS have already been extensively studied, there have been few attempts to build predictive models using readily available data, such as routine laboratory tests in a hospital. Of the models assessed in the present study, Model 4, with a threshold value of 0.5, was found to achieve the strongest performance. Each model included the parameters of the previous model and a newly added section. In Model 4, the CK values for visit 4 were predicted using the baseline characteristics and eGFR/CK values for visits 1, 2, and 3. In other words, the AUROC is higher as the period is extended because more variables are included. In fact, given that SAMS is reported most frequently at approximately 6 months after prescribing the statins, it is expected that meaningful conclusions can only be made using data from at least a 1-year study.9) The level of accuracy was also found to be the highest in Model 4. However, a low sensitivity and PPV indicate the need to supplement the model parameters.
As previously discussed, it is unclear whether the increase in CK values was actually caused by statins. Various machine learning methods have been used in different studies to predict the actual SAMS and obtain objective parameters. In a recent study, an accuracy of 90% using RNA-seq was reported20) along with an AUROC of >0.9 using potentially functional SNPs.21) However, these are not predictive models that can be easily applied clinically, and to the best of our knowledge, there are no predictive modeling studies on changes in the CK. For this reason, data construction is being actively conducted to lay the foundation for the prevention of statin side effects (although not specifically to prevent SAMS).22)
In this study, SHAP was used to determine the importance of changes in the CK and its characteristics. SHAP is a value obtained by combining several characteristics to determine the importance of a single characteristic, and by changing the average according to the presence or absence of this characteristic.23) SHAP is a method based on the Shapley value, and can show explanatory properties even with a small number of features.24) The biggest factor influencing the CK was sex. In fact, in other studies, SAMS is known to be more of a risk factor for women than for men.7) The immediately prior CK value also has a significant impact, which is a natural result. In one of the patients, the CK level was over 2,000 IU·L−1 just prior to the examination, which seems to be why it was constantly maintained. In fact, as a guideline,25) a statin prescription is not recommended in situations in which CK values exceed 2,000 IU·L−1. However, because this study was a retrospective cohort study, these findings were included.18) In the future, studies on the prescription of statins for patients with a high CK will be of significance. In fact, the history of CK elevation is also a well-known risk factor for SAMS.26) In addition, it has been well documented in previous studies that AST, creatinine, eGFR, and age are also factors influencing the change in the CK. The results of the present study are somewhat consistent with the findings of previous studies showing side effects of known statins.7) In this regard, the inability to identify the type and strength of statins in advance is one of the biggest limitations of the present study.
Hypothyroidism and the use of gemfibrozil, both of which are known to cause an increase in CK,27)28) did not have a significant effect on the results of this study. Even if the patient was diagnosed with hypothyroidism, it was presumed that they had already taken thyroxine to maintain a euthyroid state. Thus, it was presumed that the change in CK was unaffected. Moreover, given that very few patients took gemfibrozil, it can be assumed that the effect on changes in the CK was small.
This study has several limitations. As one of the biggest limitations, the type of statin used was not investigated. Although the dose of the statins may be a limitation, there are many reports indicating that there is no association between the statin dose and the occurrence of myopathy.16) Second, the data on the CK measurements at each visit were missing in this study. Of course, if the patient complained of myopathy, the physician would check the CK according to the guidelines. Therefore, it was assumed that the absence of CK level measurements would exclude the occurrence of myopathy. Finally, owing to the nature of a retrospective cohort study, there are inherent limitations to this research.18)19) Because the data were not collected firsthand, there could be various confounding factors affecting the change in the CK. The results of this study can only explain the correlation, not the causation. The AUROC of the prediction model in this study is 0.709–0.769, which is not much higher than expected. In the future, for actual clinical applications, it will be necessary to determine the optimal parameters of the model. We hope that this study will serve as a basis for future research.
SAMS is a strong factor influencing treatment compliance,29) and there are concerns regarding increased cardiovascular risk owing to a premature discontinuation. Therefore, if the factors affecting the occurrence of SAMS can be identified at an early stage, it will be of great help in actual clinical practice. An important aspect of any predictive model is the availability of accurate data.30) In this study, the factors affecting SAMS did not show a significant difference from the results of previous studies. Therefore, it was possible to have some confidence in the machine learning methodology used in this study, and it was possible to predict the weight of the factor for the change in the CK to a certain extent. In follow-up studies, it will be necessary to search for and determine the optimal parameters of the model for actual clinical applications. In conclusion, the methodology and results of this study will form the basis for future work on predictive modeling. The next step is to build a more sophisticated model that includes drugs, comorbidities, and types of statins affecting SAMS.

Funding

This work was supported by a National Research Foundation of Korea (NRF) grant funded by the Korean government (MSIT) (No. 2020R1A2C1003464).

Conflict of Interest

The authors have no financial conflicts of interest.

Author Contributions

Conceptualization: Kim HS, Yoo SJ; Data curation: Kim HS, Min J, Shinn J, Hong OK, Son JW, Lee SS, Kim SR, Yoo SJ; Formal analysis: Kim HS, Min J, Hong OK, Son JW, Lee SS, Kim SR, Yoo SJ; Methodology: Kim HS, Son JW, Lee SS, Kim SR, Yoo SJ; Supervision: Yoo SJ; Writing - original draft: Kim HS, Yoo SJ; Writing - review & editing: Yoo SJ.

Figure 1.
AUROC curves for the prediction of a change in CK.
AUROC = area under the receiver operating characteristic; CK = creatine kinase.
cpp-2021-3-e15f1.jpg
Figure 2.
. Variables affecting changes in CK level. (A) Average impact on magnitude of model output based on mean SHAP value and (B) impact on model output based on SHAP value.
AST = aspartate aminotransferase; CK = creatine kinase; eGFR = estimated glomerular filtration rate; HDL-C = high-density lipoprotein cholesterol; LDL-C = low-density lipoprotein cholesterol; SHAP = SHapley Additive exPlanations.
cpp-2021-3-e15f2.jpg
Table 1.
Baseline characteristics (n=23,860)
Characteristics Values
Age (years) 58.2±13.2
Sex
 Male 11,593 (48.6)
 Female 12,267 (51.4)
Height (cm) 162.6±9.0
Weight (kg) 64.5±12.4
BMI (kg/m2) 24.3±3.6
Systolic blood pressure (mmHg) 129±18
Diastolic blood pressure (mmHg) 75±12
BUN (mg/dL) 18.1±11.5
Creatine (mg/dL) 1.2±1.6
eGFR (mL/min/1.73 m2) 79.9±28.1
AST (mg/dL) 27±47
ALT (mg/dL) 29±47
Total cholesterol (mg/dL) 207±55
Triglyceride (mg/dL) 158±125
HDL-C (mg/dL) 48±14
LDL-C (mg/dL) 127±43
CK (IU·L−1) 82±41
Past history
 Hypertension 6,506 (27.3)
 Diabetes mellitus 8,296 (34.8)
 Hypothyroidism 1,759 (7.4)
 Cancer 4,150 (17.4)
Current medication
 Fenofibrate 674 (2.8)
 Gemfibrozil 35 (0.1)
 Propranolol 712 (3.0)
 Thyroxine 1,598 (6.7)
 Warfarin 557 (2.3)
Type of statin intensity
 Low-intensity statin 2,233 (9.4)
 Moderate-low intensity statin 13,034 (54.6)
 Moderate-high intensity statin 6,851 (28.7)
 High-intensity statin 1,742 (7.3)

Categorical variables were reported as frequencies (%), and continuous variables were reported as mean±standard deviation.

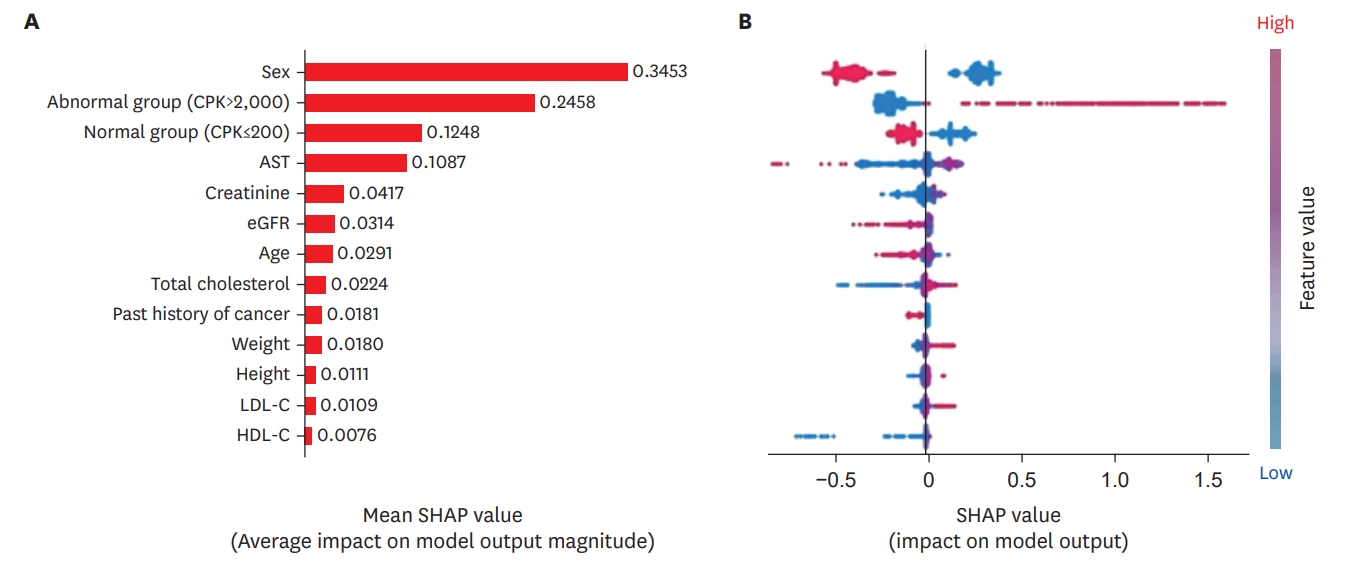
ALT = alanine aminotransferase; AST = aspartate aminotransferase; BUN = blood urea nitrogen; CK = creatine kinase; eGFR = estimated glomerular filtration rate; HDL-C = high-density lipoprotein cholesterol; LDL-C = lowdensity lipoprotein cholesterol.

Table 2.
Predictive values of each model of change in CK
Model AUROC Accuracy Sensitivity Specificity PPV NPV
Prediction model V1 0.709 0.700 0.579 0.710 0.134 0.955
Prediction model V2 0.736 0.701 0.647 0.706 0.156 0.960
Prediction model V3 0.766 0.803 0.574 0.825 0.238 0.953
Prediction model V4 0.769 0.777 0.596 0.793 0.211 0.955

AUROC = area under the receiver operating characteristic; CK = creatine kinase; NPV = negative predictive value; PPV = positive predictive value.

  • 1. Davignon J. Beneficial cardiovascular pleiotropic effects of statins. Circulation 2004;109:III39–43.ArticlePubMed
  • 2. Mihos CG, Pineda AM, Santana O. Cardiovascular effects of statins, beyond lipid-lowering properties. Pharmacol Res 2014;88:12–9.ArticlePubMed
  • 3. Sewright KA, Clarkson PM, Thompson PD. Statin myopathy: incidence, risk factors, and pathophysiology. Curr Atheroscler Rep 2007;9:389–96.ArticlePubMed
  • 4. Thompson PD, Clarkson P, Karas RH. Statin-associated myopathy. JAMA 2003;289:1681–90.ArticlePubMed
  • 5. Kim H, Kim N, Lee DH, Kim HS. Analysis of national pharmacovigilance data associated with statin use in Korea. Basic Clin Pharmacol Toxicol 2017;121:409–13.ArticlePubMed
  • 6. Tobert JA, Newman CB. The nocebo effect in the context of statin intolerance. J Clin Lipidol 2016;10:739–47.ArticlePubMed
  • 7. Sathasivam S, Lecky B. Statin induced myopathy. BMJ 2008;337:a2286. ArticlePubMed
  • 8. Mohaupt MG, Karas RH, Babiychuk EB, Sanchez-Freire V, Monastyrskaya K, Iyer L, Hoppeler H, Breil F, Draeger A. Association between statin-associated myopathy and skeletal muscle damage. CMAJ 2009;181:E11–8.ArticlePubMedPMC
  • 9. Hansen KE, Hildebrand JP, Ferguson EE, Stein JH. Outcomes in 45 patients with statin-associated myopathy. Arch Intern Med 2005;165:2671–6.ArticlePubMed
  • 10. Tianqi C, Guestrin C. Xgboost: A scalable tree boosting system. In: In: Proceedings of the 22nd ACM SIGKDD International Conference on Knowledge Discovery and Data Mining 2016; 2016 Aug 13-17; San Francisco, CA. New York, NY. Association for Computing Machinery. 2016;pp 785–94.
  • 11. Friedman JH. Greedy function approximation: a gradient boosting machine. Ann Stat 2001;29:1189–232.Article
  • 12. Shavitt I, Segal E. Regularization learning networks: deep learning for tabular datasets. In: In: Proceedings of the 32nd International Conference on Neural Information Processing Systems 2018; 2018 Dec 3-8; Montréal, Canada. Red Hook, NY. Curran Associates Inc.2018;pp 1386–96.
  • 13. Abou Omar KB. XGBoost and LGBM for Porto Seguro's Kaggle challenge: A comparison Semester Project [Internet]. Zürich: ETH Zurich; 2018 Jan [cited 2021 Sep 10]. Available from: https://pub.tik.ee.ethz.ch/students/2017-HS/SA-2017-98.pdf
  • 14. Cai H, Zhong R, Wang C, Zhou R, Zhou K, Lee H, Xu K, Gao Z, Zhong R, Luo J, Zhou Y, Ding M, Li L, Li Q, Li D, Jiang N, Cheng X, Cui S, Ye H, Shen J. KDD CUP 2017 travel time prediction. [place unknown]: KDD; 2017 [cited 2021 Sep 10]. Available from: https://www.kdd.org/kdd2017/files/Task1_3rdPlace.pdf
  • 15. Faasse K, Gamble G, Cundy T, Petrie KJ. Impact of television coverage on the number and type of symptoms reported during a health scare: a retrospective pre-post observational study. BMJ Open 2012;2:e001607.ArticlePubMedPMC
  • 16. Newman CB, Palmer G, Silbershatz H, Szarek M. Safety of atorvastatin derived from analysis of 44 completed trials in 9,416 patients. Am J Cardiol 2003;92:670–6.ArticlePubMed
  • 17. Gupta A, Thompson D, Whitehouse A, Collier T, Dahlof B, Poulter N, Collins R, Sever P; ASCOT Investigators. Adverse events associated with unblinded, but not with blinded, statin therapy in the AngloScandinavian Cardiac Outcomes Trial-Lipid-Lowering Arm (ASCOT-LLA): a randomised double-blind placebo-controlled trial and its non-randomised non-blind extension phase. Lancet 2017;389:2473–81.ArticlePubMed
  • 18. Kim HS, Kim JH. Proceed with caution when using real world data and real world evidence. J Korean Med Sci 2019;34:e28.ArticlePubMedPMC
  • 19. Kim HS, Lee S, Kim JH. Real-world evidence versus randomized controlled trial: clinical research based on electronic medical records. J Korean Med Sci 2018;33:e213.ArticlePubMedPMC
  • 20. Pinal-Fernandez I, Casal-Dominguez M, Derfoul A, Pak K, Miller FW, Milisenda JC, Grau-Junyent JM, Selva-O’Callaghan A, Carrion-Ribas C, Paik JJ, Albayda J, Christopher-Stine L, Lloyd TE, Corse AM, Mammen AL. Machine learning algorithms reveal unique gene expression profiles in muscle biopsies from patients with different types of myositis. Ann Rheum Dis 2020;79:1234–42.ArticlePubMed
  • 21. Ooi BNS, Ying AF, Koh YZ, Jin Y, Yee SW, Lee JH, Chong SS, Tan JW, Liu J, Lee CG, Drum CL. Robust performance of potentially functional SNPs in machine learning models for the prediction of atorvastatin-induced myalgia. Front Pharmacol 2021;12:605764. ArticlePubMedPMC
  • 22. Chi CL, Wang J, Clancy TR, Robinson JG, Tonellato PJ, Adam TJ. Big data cohort extraction to facilitate machine learning to improve statin treatment. West J Nurs Res 2017;39:42–62.ArticlePubMed
  • 23. Ogami C, Tsuji Y, Seki H, Kawano H, To H, Matsumoto Y, Hosono H. An artificial neural networkpharmacokinetic model and its interpretation using Shapley additive explanations. CPT Pharmacometrics Syst Pharmacol 2021;10:760–8.ArticlePubMedPMC
  • 24. Merrick L, Taly A. The explanation game: explaining machine learning models using Shapley values. In: Holzinger A, Kieseberg P, Tjoa A, Weippl E, editors. Machine Learning and Knowledge Extraction. CDMAKE 2020. Lecture Notes in Computer Science, Vol 12279. Cham, Springer; 2020. p. 17–38.
  • 25. Lempp D. An evidence-based guideline for treating dyslipidemia in statin-intolerant patients. J Nurse Pract 2021;17:910–5.Article
  • 26. Harris LJ, Thapa R, Brown M, Pabbathi S, Childress RD, Heimberg M, Braden R, Elam MB. Clinical and laboratory phenotype of patients experiencing statin intolerance attributable to myalgia. J Clin Lipidol 2011;5:299–307.ArticlePubMed
  • 27. Tokinaga K, Oeda T, Suzuki Y, Matsushima Y. HMG-CoA reductase inhibitors (statins) might cause high elevations of creatine phosphokinase (CK) in patients with unnoticed hypothyroidism. Endocr J 2006;53:401–5.ArticlePubMed
  • 28. van Puijenbroek EP, Du Buf-Vereijken PW, Spooren PF, van Doormaal JJ. Possible increased risk of rhabdomyolysis during concomitant use of simvastatin and gemfibrozil. J Intern Med 1996;240:403–4.ArticlePubMed
  • 29. Maningat P, Gordon BR, Breslow JL. How do we improve patient compliance and adherence to long-term statin therapy? Curr Atheroscler Rep 2013;15:291. ArticlePubMedPMC
  • 30. Kim HS, Kim DJ, Yoon KH. Medical big data is not yet available: why we need realism rather than exaggeration. Endocrinol Metab (Seoul) 2019;34:349–54.ArticlePubMedPMC

Figure & Data

References

    Citations

    Citations to this article as recorded by  

      Figure

      CPP : Cardiovascular Prevention and Pharmacotherapy